Tags
Python
ReactJS
Express
MySQL
Socket.io
Plotly
Algorithm Design
Web Application
Algorithmic Trading Bot
My overly-ambitious dissertation project, designed to answer one painfully naive question... 'Can you beat the stock market?'
Python
ReactJS
Express
MySQL
Socket.io
Plotly
Algorithm Design
Web Application
22 Feb 2021 - 12 Jun 2021
Investing in stocks has always been something that I wanted to learn how to do, I would always hear stories online of people that would be making considerable profits through it, allowing them to live a life that not many would even dream of being able to achieve in their lifetimes. I was always put off getting started with it though due to the obvious high-risks, and the incredibly steep learning curve that comes with it.
That was until the UK lockdown was announced in March 2020. I found myself with way too much time on my hands, and a final year project to plan. So I decided to not only learn how to work the stock market by applying specific strategies, but to also see if it could be beaten by automating these analysis techniques that people would normally be spending hours a day doing manually.
Features

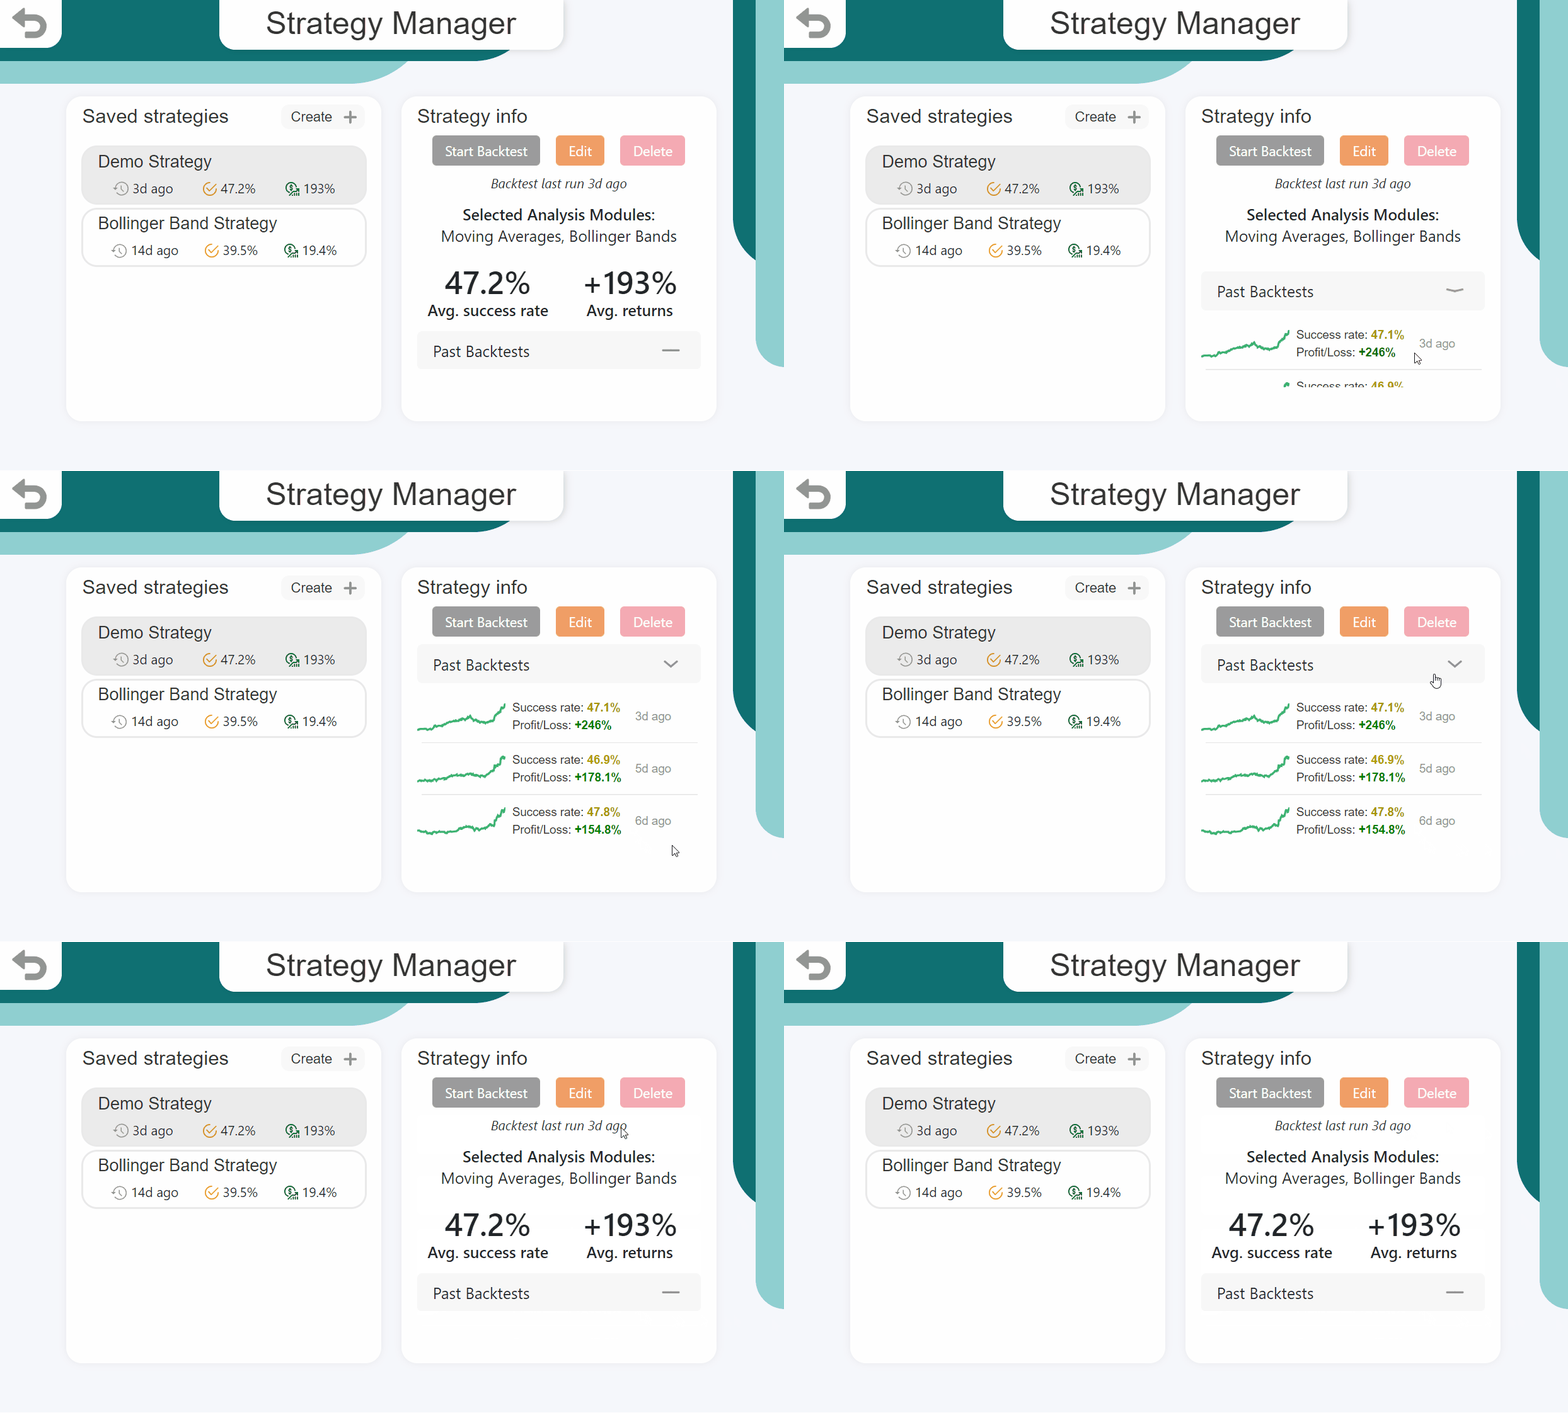
Save and compare strategies
Multiple strategies can be created and tested against the libraries of historical data, with the results displayed in a way that makes it easy to compare them against each other.
Dynamic utilization of analysis modules
The project has been built to make it as easy as possible for developers to create code that automates any new technical analysis techniques they learn in their trading journey. These analysis modules have a common API that the application uses to allow them to be dynamically loaded into the backtesting engine, meaning that developers can add new functionality to the system without needing to make any changes to the original project code!
(click image to enlarge)
(click image to enlarge)
Real-time backtest progress updates
The user interface is designed to allow the user to see all information on the current state of the backtests at a glance whilst also providing functionality to drill-down into certain elements, e.g. clicking on a trade will open a modal that displays more information on what influenced it. A socket.io connection is used to ensure only the most recent data is shown to the user, which will be critical when the functionality to work with real money on real-time data is introduced.
Detailed strategy configuration options
Not only does this project aim to make the addition of functionality incredibly simple for developers, every analysis module created can be fully customised with a dynamically generated form in the UI, allowing for strategies to be tweaked quickly and easily without needing to make any changes to the code.
(click image to enlarge)

Save and compare strategies
Multiple strategies can be created and tested against the libraries of historical data, with the results displayed in a way that makes it easy to compare them against each other.
Dynamic utilization of analysis modules
The project has been built to make it as easy as possible for developers to create code that automates any new technical analysis techniques they learn in their trading journey. These analysis modules have a common API that the application uses to allow them to be dynamically loaded into the backtesting engine, meaning that developers can add new functionality to the system without needing to make any changes to the original project code!
(click image to enlarge)